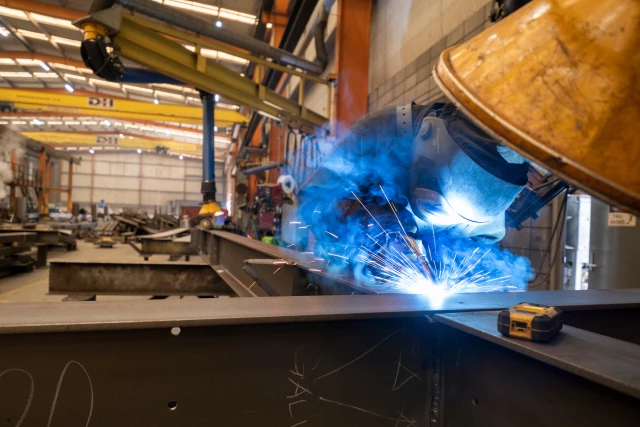
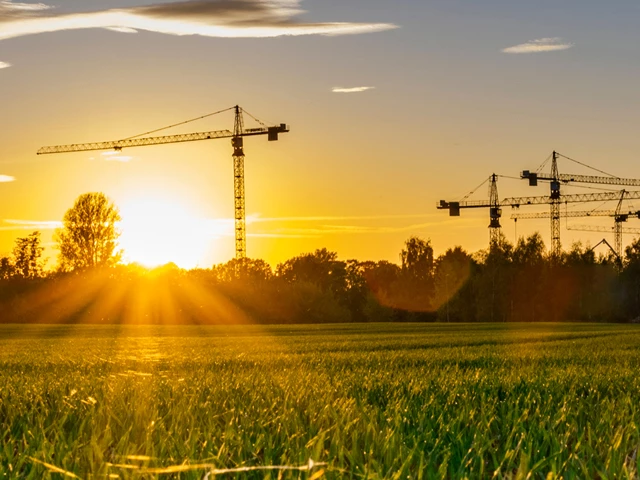
-
$53.1 billionFood and Fibre Sector Export Revenue year to June 2022 (MPI)
-
81.4%Food and Fibre Sector Contribution to National Export Trade in year to June 2022 (Stats NZ, MPI)
-
10.7%Contribution to National GDP for year ending March 2021 (Stats NZ, MPI)
-
ChinaLargest export market (35%) for all Food and Fibre Products for year to June 2022 (Stats NZ, MPI)
-
13%of New Zealand’s Workforce was Employed in Food and Fibre Sector in year ending March 20201, (Stats NZ, MPI)
-
16%of the Muka Tangata Industries Workforce were Māori in 2020 (Stats NZ IDI)
-
25 – 34 year oldsLargest Age Bracket within Muka Tangata Industries Workforce in 2020 (Stats NZ IDI)
-
~4600Number of Māori-owned Businesses in the Muka Tangata Industries in 2020 (Stats NZ IDI)
Our industries
Not sure what industry?
Muka Tangata look after 14 industries in the food and fibre sector. Details of who is in each industry group can be found here.
Learn more about Muka Tangata Workforce Development Plans